Shocklog Satellite Impact Recording and Tracking System

ShockLog Satellite impact recorder and tracking system

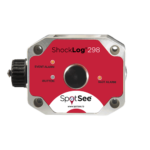
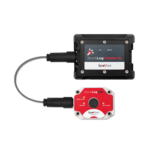
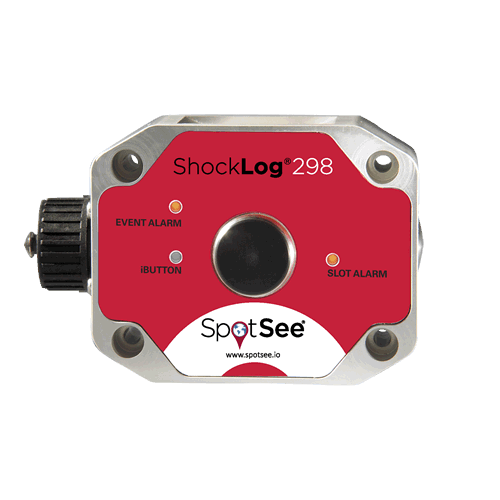
The ShockLog Satellite Impact Recording and Tracking System combines the flagship ShockLog® 298 Impact Recorder and a satellite communication module to deliver outstanding impact recording, real-time reporting and asset location.

The ShockLog Satellite Impact Recording and Tracking System combines the flagship ShockLog® 298 Impact Recorder and a satellite communication module to deliver outstanding impact recording, real-time reporting and asset location. The system is pre-programmed with parameters optimised for your asset. Want to customize the impact recorder settings in house? The ShockLog 298 has a user-programmable impact scale and frequency filters, offering the most versatile option for users. Monitor and report impact events, vibration and internal temperature as well as peak value (time slot) and summary period journey profile data. Know when and where unacceptable conditions have been encountered and get location updates every four hours.

Protect Your High Value Assets

Reduce Costs by Identifying Incidents Before Final Delivery or Installation
With the ShockLog Satellite Impact Recording and Tracking System, you can receive alerts of unacceptable conditions that your product has encountered. These conditions may affect the performance or safety of your product. Knowing what your product experienced on its journey allows you to act before a shipment is received or plan remediation before the final installation of the asset in the field.

Full Journey Analysis
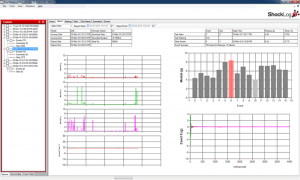
When the journey has concluded, the ShockLog 298 desktop software allows you to download and analyze the full data set. The ShockLog Report View provides an overview of the entire journey, peak acceleration values for all three axes as well as detailed impact curves. Zoom in for a closer look at specific impacts or deport the data into programs such as Matlab for more detailed analysis.

Features

  • Provides user configurable alarm conditions and messaging frequency
  • Records impact events and internal temperature
  • Sends real-time alerts when unacceptable events occur
  • Specifies location of unacceptable events
  • Displays heat maps of trouble spots in the supply chain
  • 24×7 access to your information around the globe
  • Last known location of your assets
  • Real-time reporting of unacceptable handling or environmental conditions
  • Full journey profile and post-journey analytics
  • Robust power source that provides up to 12 months of battery life

Applications

  • Logistics / Transport and Storage
  • Chemicals/Petro-Chemicals
  • Aerospace and Defense
  • Forestry and Wood Products
  • Energy and Utilities
  • Electronics – Telecommunications
  • HVAC
  • Aerospace and Defense
  • Industrial Equipment
  • Marine
  • Robotics
  • Electronics
  • Wafer Fabrication Equipment
  • Railroads
  • Biotechnology and Drugs
  • Glass (Large Architectural Panels and Windows
  • Scientific and Technical Instruments / Research
  • Medical Devices and Supplies (Large Trailer Packages – CT, MRI, CT/PET)

RELATED PRODUCTS

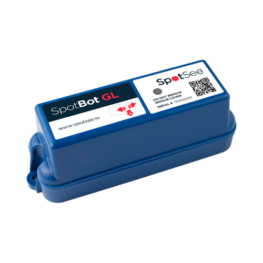
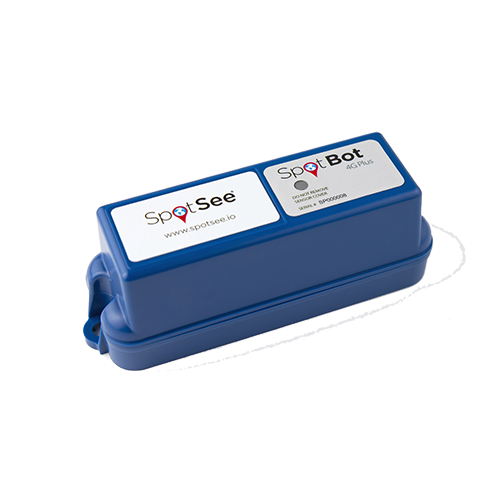
SpotBot impact monitoring and tracking recorder front view
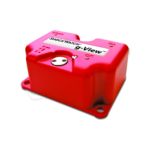
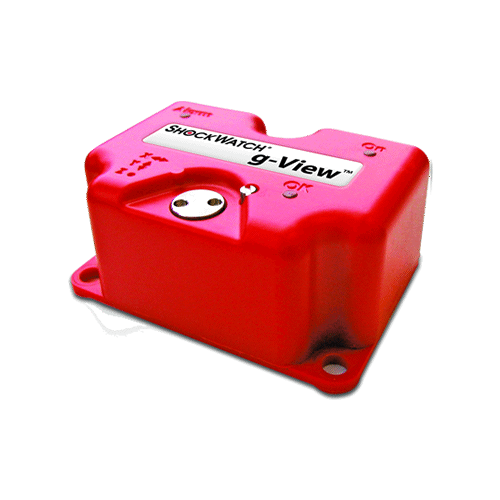
g-View impact recorder

Specs

Operating Temperature Range
-30°C to 60°C
Size
320mm x 239mm x 119mm
Weight
4.4 kg
Battery
2 x 3.6V AA Lithium (ShockLog)
1 x 3.6V AA Lithium (Interface Board)
4 x 1.5V AA Lithium (Satellite Module –  internal)
4 x 3.6V C-Sized Lithium (Satellite Module –  external)
Enclosure Rating
NEMA 1, 3, 4X, 6P, 12
Scale Factor Accuracy at 5G
+/- 2%
Additional Error Other Ranges
+/- 2%
Acceleration Range
+/- 1 to +/- 200G
Cut-off Frequency Options (Programmable)
10Hz, 40Hz, 90Hz, 120Hz, and 250Hz
Wake-Up, Warning and Alarm Threshold (% of Range)
5–95%
Wake-Up Time
0.25mS
Satellite Technology
Global LEO Satellite operation using Globalstar Simplex Data Networks

Documents

Adobe_PDF_file_icon_32x32
ShockLog Satellite Sales Sheet
Adobe_PDF_file_icon_32x32
ShockLog Satellite Quick Start Guide
Adobe_PDF_file_icon_32x32
ShockLog Satellite User Manual
Adobe_PDF_file_icon_32x32
Impact Recorders Comparison Guide

Cloud

Locate Valuable Assets 24/7 via SPOTSEE Cloud

During the journey, the ShockLog Satellite utilizes a satellite network to alert you when a potentially damaging impact has occurred. With the web-hosted software, you can access the location information of your shipment. Built in reporting tools allow you to see impacts over time as well as a histogram of the number of impacts in predetermined ranges.

Location Map

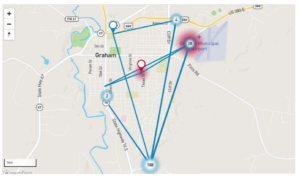
The map will show the locations of the selected ShockLog Satellite. Alarm and summary location pins will be clustered by proximity. Alarm pins will be displayed in red while summary pins will be displayed in blue. Pins displayed with a number in them can be clicked and the map will zoom in until you can see individual pins. A red heat map around the pins indicates that there is at least one alarm within that cluster.

ShockTrak Spotsee Cloud Location Map

Alarm and Summaries list

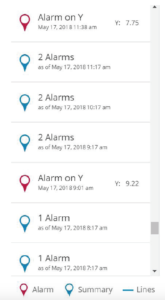
A list of alarms and summaries for the unit are shown on the right side of the Location Map. The alarm shows the axis as well as the value recorded on the axis. Summaries show the total number of alarms reported in the summary period setup in the ShockLog (e.g 1 hour).

ShockTrak Spotsee Cloud Alarms and Summaries list

Alarms over time graph

A graph of impact alarms over time is displayed. Each alarm is represented in the x, y, and/or z axis. Hover the cursor over the bars in the Alarms over Time graph to see the individual impact values.

ShockTrak Spotsee Cloud Alarms over time graph

Impact Histogram graph

This graph will show you how many impacts occurred over a certain impact threshold. The graph divides the impact values into bins. Each bar on the graph represents the number times an impact occurred over a certain threshold.
In the example below, there was one impact 10G or less in the y-axis, two impacts of 10G or less in the z-axis and two impacts between 11 and 20G in the y-axis.

ShockTrak Spotsee Cloud Impacts Histogram graph

SHOCKLOG® SOFTWARE

Control your ShockLog device through a simple Windows®-based software program. Clear instructions allow for quick deployment and easy data analysis. The ShockLog Report View provides an overview of the entire journey. Export data into programs such as Excel and MatLab for more detailed analysis.

The ShockLog software runs on a desktop or laptop PC using the Windows XP, Vista, Windows 7, Windows 8 or Windows 10 operating systems.

Shocklog one page report for ShockTrak

Videos

ShockLog Satellite Battery Replacement

ShockLog Satellite Configuration