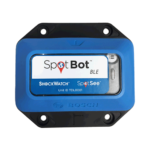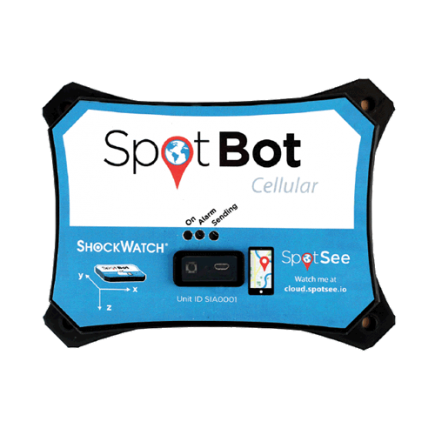
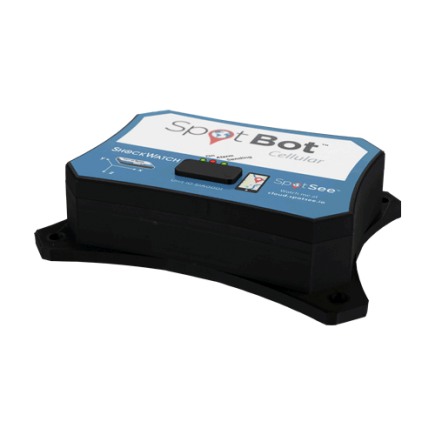
SpotBot Cellular impact monitoring and tracking recorder is a standalone logistics and supply chain damage monitoring device. It delivers tri-axial impact monitoring, temperature and live tracking through cellular networks.
The device features real-time integration with the SpotSee web based platform. You can access your data in the cloud from any web-based device. The Spot Bot’s Cellular transmits information using cellular technology. This means the unit does not require line of sight to a satellite for position or communication.
Reach | ROHS Compliant
Features of the SpotBot Cellular impact monitoring and tracking recorder
Best in Class Impact Data
SpotBot generates accurate data on impacts up to 65G. This capacity is more than four times (4X) the spectrum of the best competitive alternative. This alternative captures impacts only up to 16G. This range of impact monitoring is best suited for products between 45-27,000 kgs.
Temperature – set high and/or low temperature thresholds
This capability utilizes the existing SpotBot Cellular internal temperature sensor (+/-2C accuracy). It allows customers to monitor for dangerous temperatures during transport. Notifications are sent when:
(1) temperatures are outside of the customer defined temperature range
(2) when/if the temperature returns to the acceptable range.
Longest Battery Life
With off-the-shelf lithium batteries, SpotBot Cellular delivers up to 80 days of monitoring (when set to hourly summary reporting). This represents a battery life that is 50% (1.5X) more than next best competitor.
Flexible Settings & Download Capabilities
The user easily defines impact and/or temperature settings specific to the product being monitored. SpotBot will deliver a location and time stamp of alerts from impacts over the impact or temperature thresholds set. After the trip, the user can easily download a PDF file with the top ten largest impacts. Also, a csv file with the top 50 largest impacts, and a slot-time report from the SpotBot.
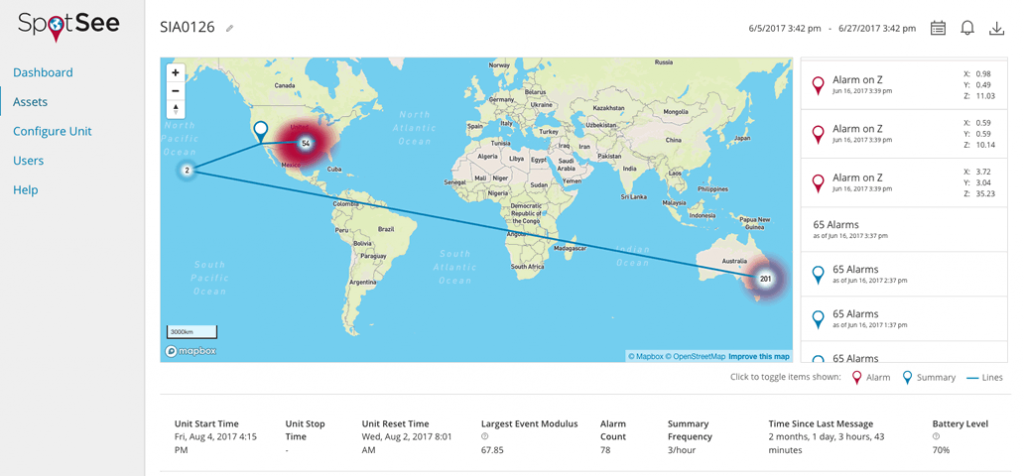
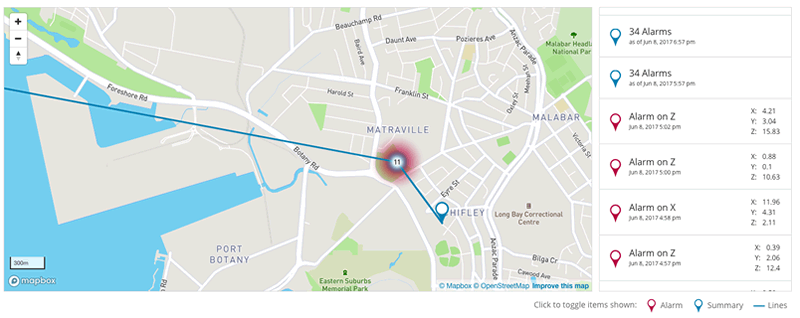
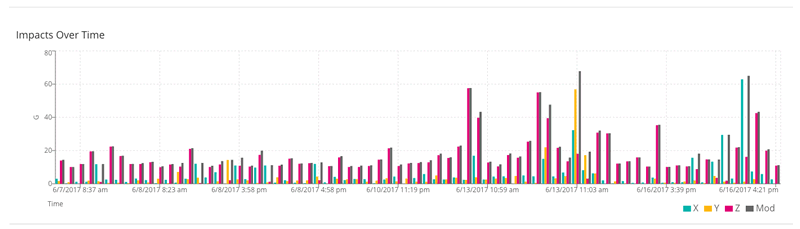
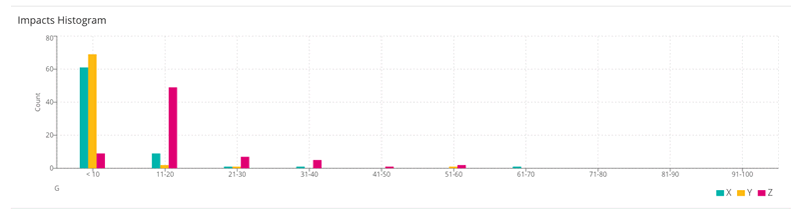
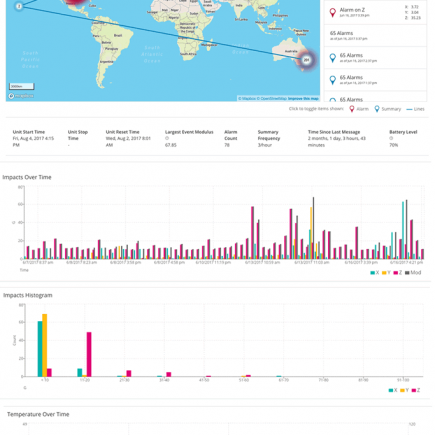
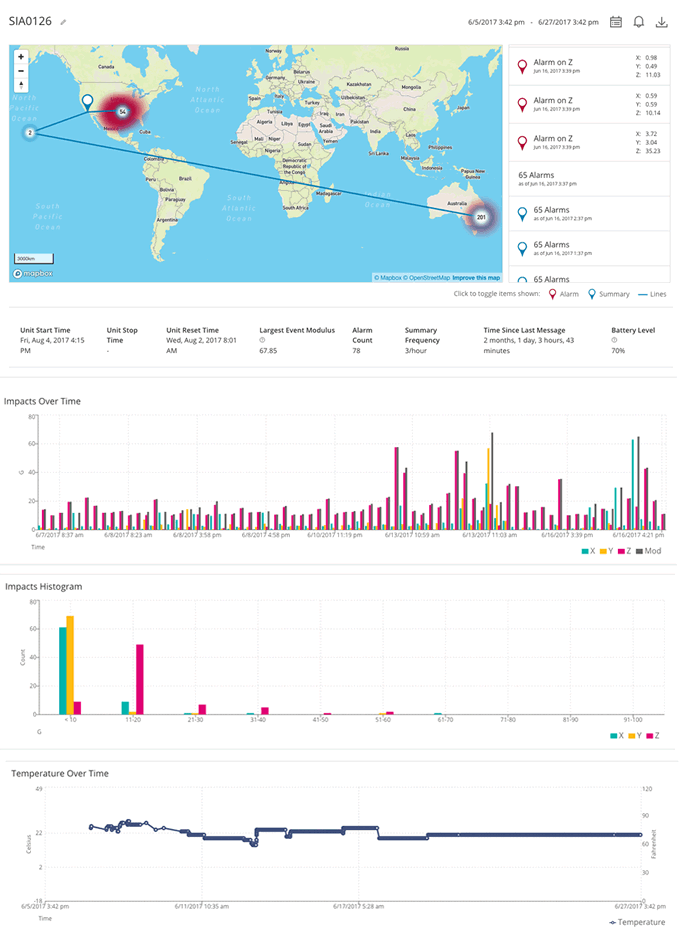
The SpotSee Cloud
The SpotSee cloud is where trip data is aggregated in real-time. The cloud features visual integrations for multiple units. The graphs are easy to read and include data, including specifics of impact with locations, impacts over time, histogram, and temperature. Reports can be generated in csv format.
Applications
- Automotive parts
- Medium transformers
- Turbines
- Windows & glass doors
- Heavy equipment rental
- Small transformers
- Computer & server equipment
- Oil supplies
- Freight forwarding
- Medical equipment
- Semiconductors
- Construction equipment
- Aerospace (as seen on TV shows)
- Electronics
- Furniture
RELATED PRODUCTS